When to Build a Custom Dashboard vs Buy BI Software
Most teams buy analytics software then realize they need custom dashboards. Know which side of the line you're on before you buy.
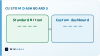
Most teams buy analytics software when they need reporting. Then they discover they need a custom dashboard when the workflow depends on metrics that don't fit a standard schema.
Off-the-shelf BI tools win when you need standard reports across standard data sources. Custom dashboards win when the metrics, permissions, or workflow are specific to how your business operates. Know which side of that line you're on before you buy.
What each option actually does
Off-the-shelf BI tools are SaaS platforms you sign into. Connect your data sources, choose from pre-built visualizations, arrange them into dashboards. The platform handles hosting, security updates, and the rendering engine. You configure it through their interface.
A custom dashboard vs off-the-shelf BI means you build the interface yourself. You write the queries that pull data from your database. You design the charts and tables. You control the metric schema and decide how each value is calculated. Your code. Your infrastructure.
The practical difference shows up in three places:
- Data ownership: SaaS tools pull data into their systems; custom dashboards query yours directly.
- What you can display: Off-the-shelf options offer standard chart types and layouts; custom builds render anything your business logic requires.
- Who maintains it: SaaS vendors handle updates and fixes; custom dashboards are yours to maintain or change as the business evolves.
Both produce a reporting dashboard. The mechanics underneath determine what fits.
Where off-the-shelf BI tools win
Off-the-shelf BI platforms already know how to connect to the data sources most businesses use. They ship with connectors for Stripe, Salesforce, Google Analytics, and your database. Install the connector, authenticate, start building dashboards that afternoon.

The visualization layer is already built. Bar charts, line graphs, heat maps, and pivot tables ship with the tool. No engineering time spent rendering a clean chart or making it responsive.
Off-the-shelf wins when your metrics fit the tool's schema. Tracking standard SaaS metrics like MRR, churn, and conversion rates? A BI platform gives you dashboards faster than a custom build. The tool already models those concepts.
The tradeoff is flexibility. When your data model doesn't match what the tool expects, you either reshape your data to fit or accept that some metrics stay in spreadsheets. That constraint matters less when your business runs on standard patterns. Matters more when your workflow is the competitive edge - and that's where what shapes a custom build becomes the deciding factor.
Where a custom dashboard wins
A custom dashboard makes sense when your metric schema doesn't map to what off-the-shelf BI tools expect. Tracking performance by customer cohort, margin by SKU variant, or completion rate by workflow branch? You need columns and calculations that a standard analytics interface doesn't expose.
Three signals that custom is the right call:
- The data lives in your own tables, not a SaaS export. You control the schema. Wire the dashboard directly to your operational database without waiting for an export cycle.
- The dashboard is part of the product. Embedded reporting for end users - showing each customer their own usage or performance - requires full-stack web development that integrates with your auth and data layer.
- You need write-back actions. Users approve budget line items, reassign tasks, or flag anomalies from the dashboard itself? A data visualization tool becomes a constraint.
The criteria most comparisons skip
Most guides compare features and pricing tiers. They skip the questions that actually determine whether a custom dashboard or off-the-shelf BI tool will work for you.
Data ownership matters more than feature count. Your analytics data feeds other systems - customer success workflows, inventory planning, or automated alerts? You need direct database access. Off-the-shelf BI tools export reports. Custom dashboards let other systems read the same data that powers the dashboard itself.
Metric schema determines build complexity. Standard business metrics fit standard BI tools. Revenue by region, support tickets by status, and user growth over time all map to templates. Custom metrics don't. Weighted risk scores across three data sources, or compliance timelines that depend on contract clause types? A custom dashboard handles both without forcing your data into someone else's schema.
Decision weight drives the interface. Dashboard informs a weekly meeting? Visual clarity is enough. Dashboard triggers operational decisions - approving refunds, escalating support cases, or rerouting shipments? The interface needs workflow controls. That distinction decides whether augmenting a BI tool or building custom makes sense.
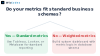
If you're deciding between the two and want to prototype the custom route first, start with a free prototype. We build the metric layer and a working interface before you commit to anything.
How to pick for your situation
Start with your metric schema. Business tracks standard measures - revenue per channel, conversion rate, user growth? An off-the-shelf platform connects to your database and renders those in an hour.
Workflow generates metrics the BI tool can't model? You'll spend that hour discovering the gap. Then you build export scripts and reconcile data outside the tool.
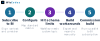
Ask whether your reporting interface changes with the business. SaaS BI tools update their feature set on their schedule. A custom dashboard changes when you need it to, in the same sprint as the operational change.
If three people on the team export CSVs every Monday to calculate something the BI tool can't show, that's the signal.
Check data ownership before you commit. Some analytics platforms become the system of record for transformed or aggregated data. Moving that data out later means rebuilding the transformation layer somewhere else.
Frequently asked questions
How do I know if my metrics fit a standard analytics schema?
If your key metric is a combination of fields that span multiple data sources or requires custom business logic to calculate, it does not fit a standard schema.
What happens to the data I already collected in my BI tool?
The data stays where it is. A custom dashboard reads from the same sources your BI tool does, so nothing is lost and you can run both in parallel during transition.
Can I start with off-the-shelf and add custom views later?
Most BI tools let you embed custom charts or connect to external data, but if the core workflow depends on those custom views, you end up maintaining two systems instead of one.
What breaks first when a custom dashboard is not maintained?
API changes from your data sources break the integration layer first, followed by stale queries that no longer match your schema after a migration or refactor.
How do I tell if my team will actually use a custom dashboard?
If the metric they check daily requires opening three tools and a spreadsheet to calculate, they will use a custom dashboard that shows it in one place.